Automated Layouts in Loop Networks (ALLN)
Libraries offer the individual/institutional learners/users the unique user experience in several areas, one of which is the ability to automatically depict a random form of networks and diagrams. The enabling automated layout have been used by users/learners in presentation: flow charts, UML diagrams, organization charts, genealogies, business process diagrams, to represent clear mathematical concepts driven in underlying software processes, etc.
The layout algorithm generates sequences of symbols which reasonably cannot be better predicted in the many software network layouts that can be supported.
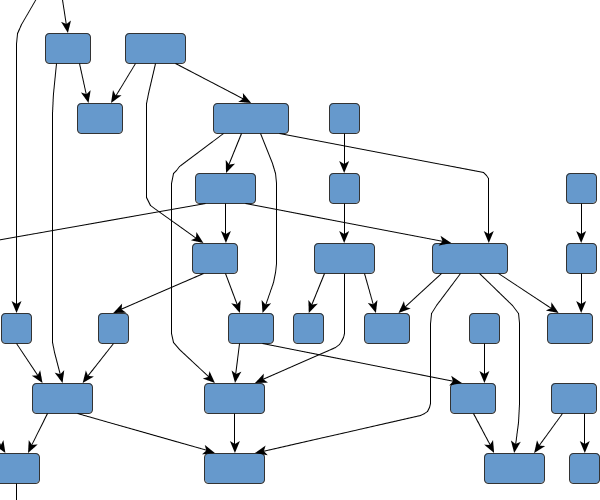
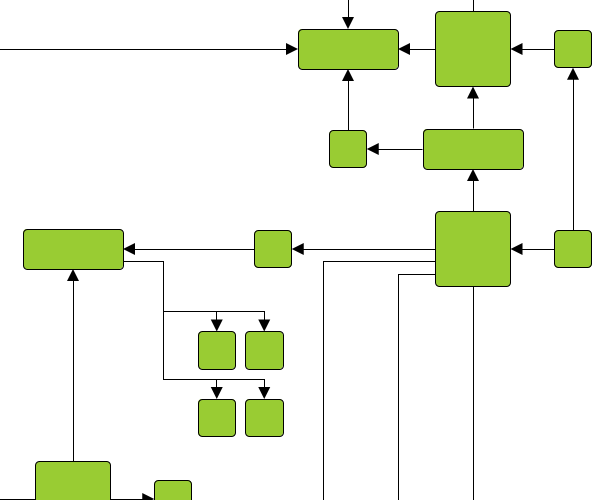
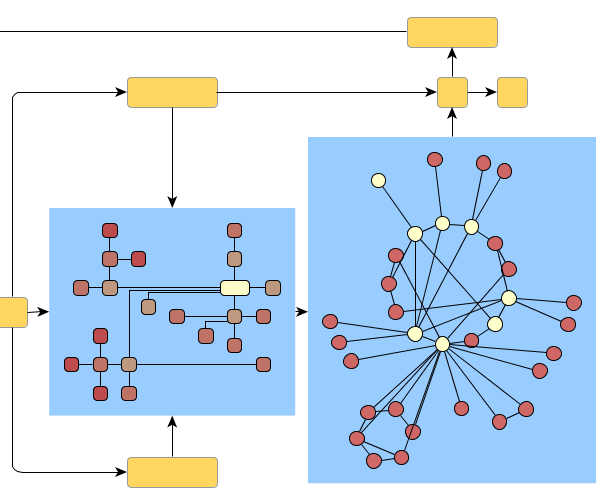
Identifying the orthogonal drawings and grouped diagrams, and also emphasizing the direction of the main flow in diagrams and networks, the hierarchy levels and dependencies are supported.
The layout process is deally suited for biochemical pathways, dependency analysis, workflow diagrams, flow charts, business process modeling, or UML diagrams.
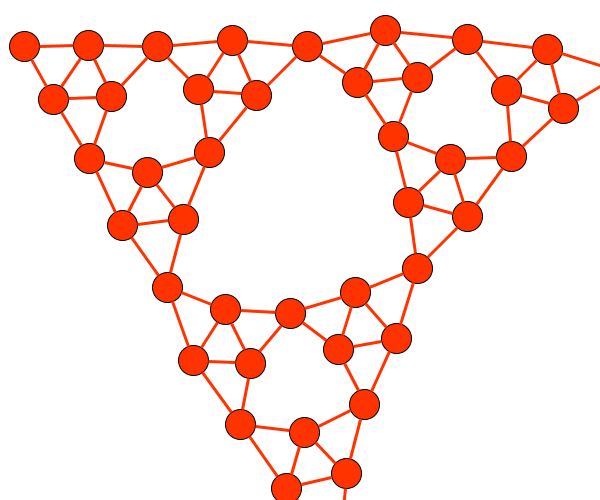
Emphasizing data-inherent groupings and symmetries and providing insight into the interconnectedness of large and complex structures, the grouped diagrams are supported.
Ideally suited for semantic networks, biochemical reaction networks, or computer network structures.
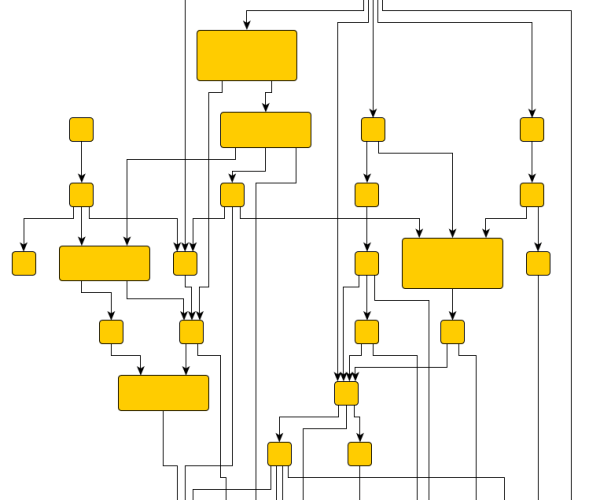
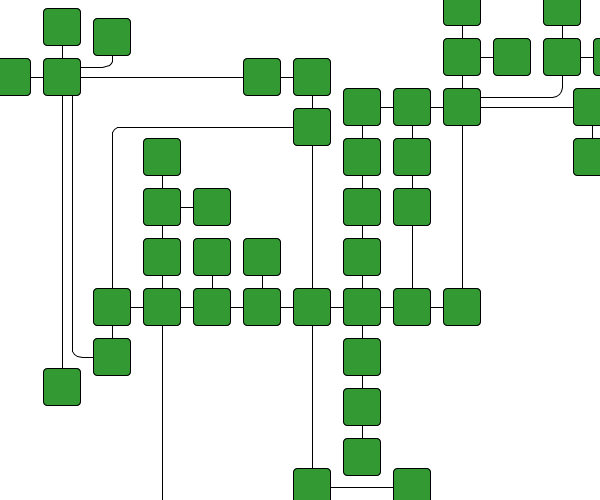
Producing clear diagrams with orthogonal connections only, where connections
are routed with minimal number of crossings and bends,
the grouped diagrams are supported in
exclusive routing of connections.
Ideally suited for database modeling, software engineering, or UML diagrams.
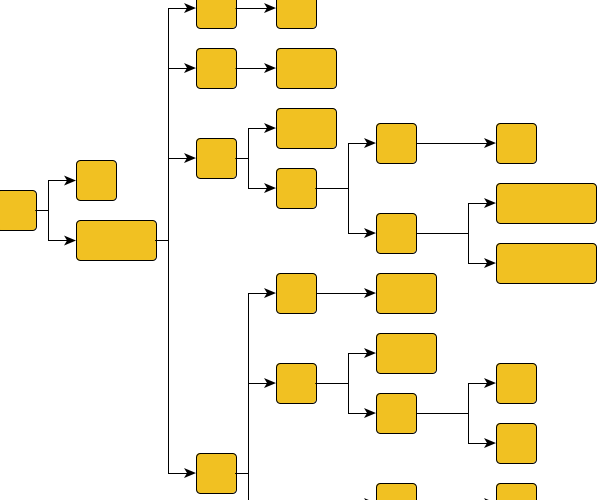
Offering directed as well as radial layouts, and supporting compact layouts, the tree-like structures are optimally arranged.
Ideally suited for genealogies, directories, mind-mapping, or organization charts.
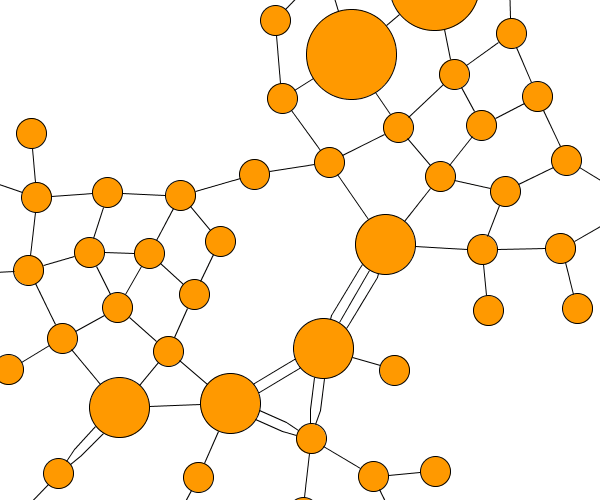
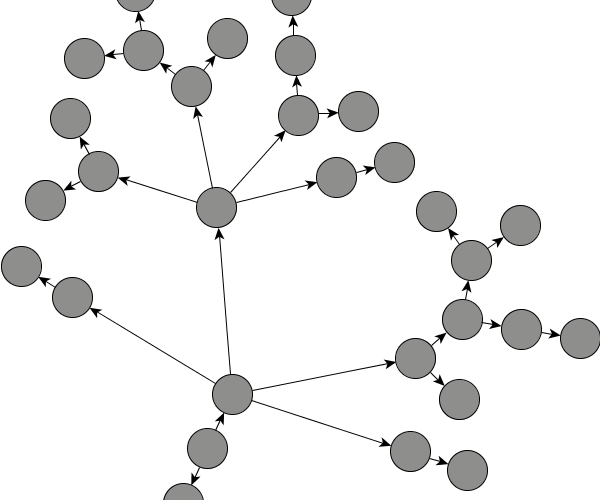
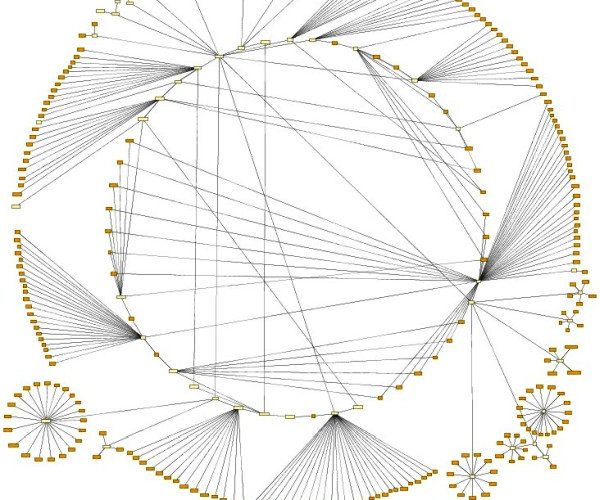
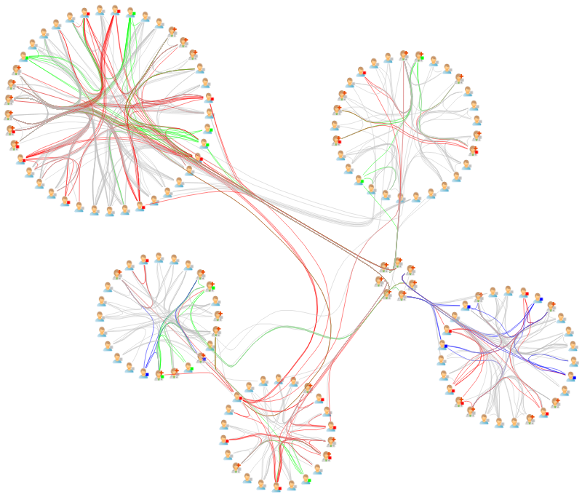
Emphasizing ring and star topologies in networks, grouped objects according to the network's structure are arranged on circles or using radial tree structures.
Ideally suited for network management, web visualization, or social networks.
Social Network Analysis (SNA)
In social network analysis, the algorithmic
analysis of social relationships is used to gain insight into the structure of a social network.
The software provides support for such analysis and enable automatic clustering,
for example.
Working in Large Graphs (WLG)
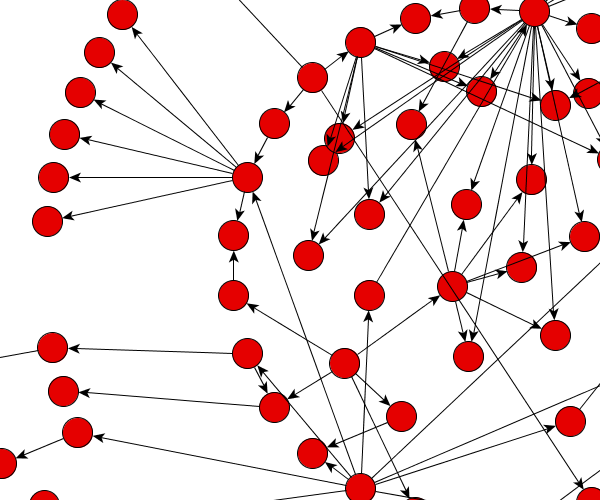
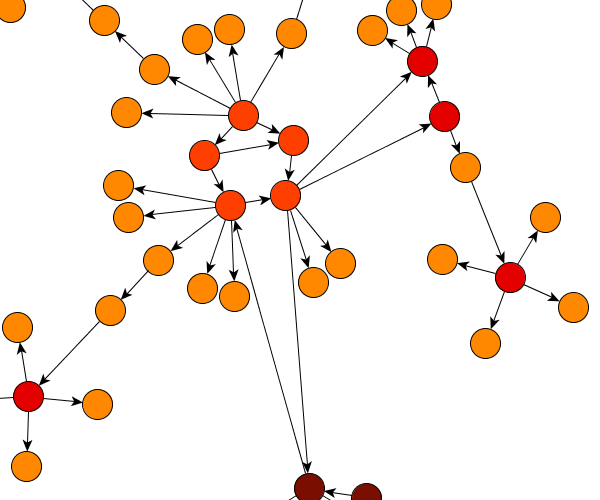
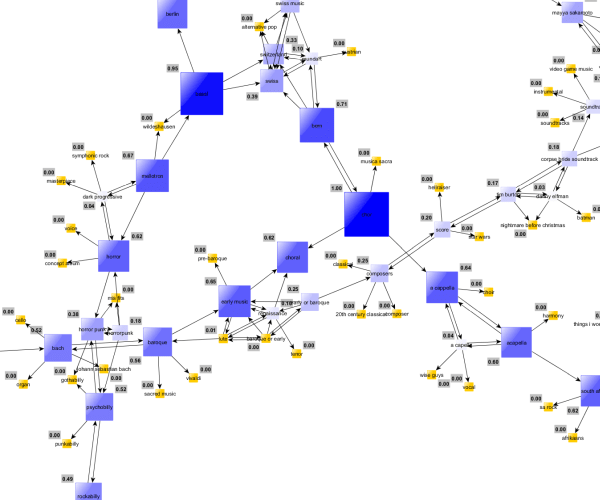
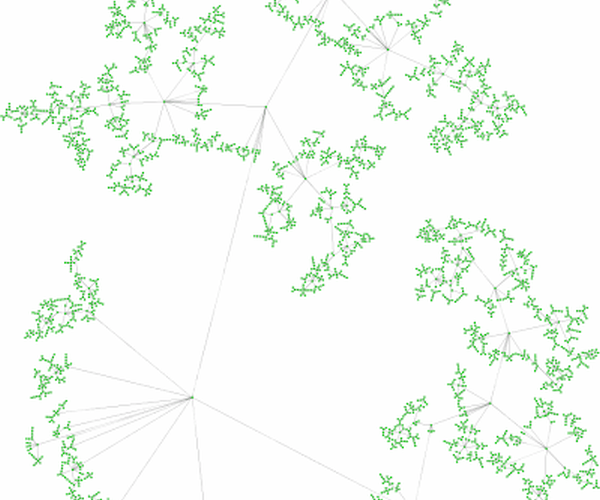
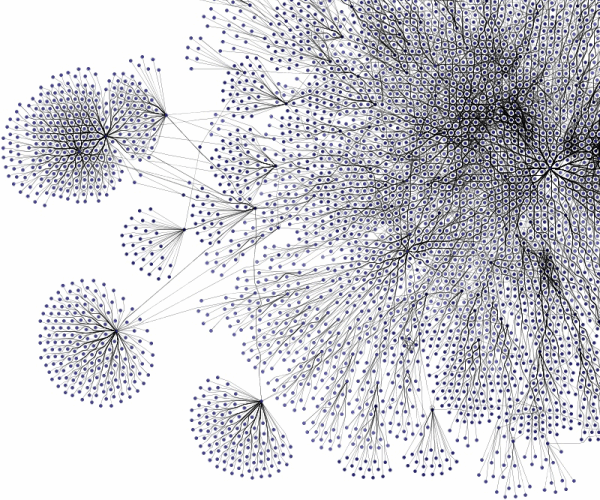
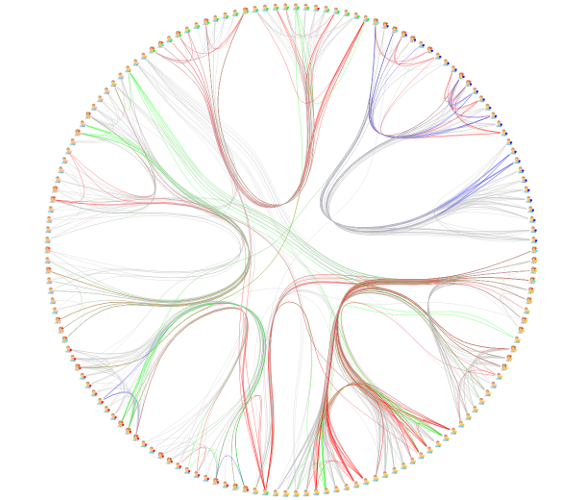
Creating, editing, and visualizing large graphs with hundreds and thousands of elements is one of the strengths of our software. The following images prove that our software can handle these diagrams and networks easily.
Nested Graph Hierarchies (NGH)
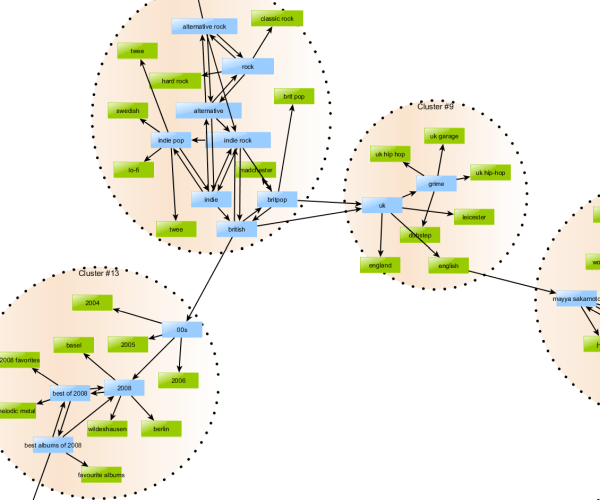
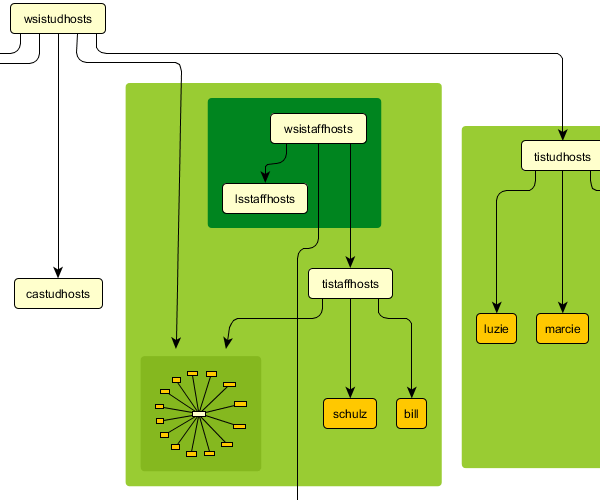
The libraries support the notion of "nested graphs," i.e., the nodes of a graph may contain graphs themselves, which can be laid out like any other graph.
6363 Christie Avenue #2202, Emeryville, CA 94608
